Appearance
节点实例
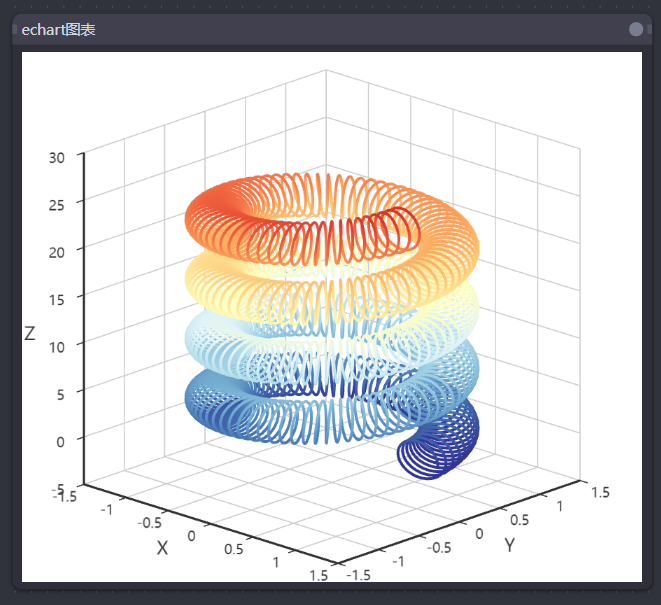
ecahrts图表节点
- 使用配置lib来引入cdn
- div设置一个初始尺寸
- 要有一个随机的id
- 使用ResizeObserver来监听尺寸变化实现自适应
vue
<template>
  <div style="height:200px;width:200px;" :id='id'></div>
</template>

<script>
  export default {
    props: ["inputs", "outputs", "serverStates"],
    emits: ["update:input"],
    data: () => {
      return {id: "echart图表" + Math.random()}
    },
    lib:[
      {name:'ecahrts',src:"https://cdn.bootcdn.net/ajax/libs/echarts/5.4.3/echarts.min.js"},
      {name:'ecahrtsGl',src:"https://cdn.bootcdn.net/ajax/libs/echarts-gl/2.0.8/echarts-gl.min.js"},
    ],
    mounted() {
      if(!window.echarts)return;
      const chartDom = document.getElementById(this.id);
      const myChart = window.echarts.init(chartDom);
      let observer = new ResizeObserver(() => {
        const width = this.$el.clientWidth;
        const height = this.$el.clientHeight;
        myChart.resize({
          width: width,
          height: height
        });
      });
      observer.observe(this.$el, {box: "border-box"});

      var option;

      var data = [];
// Parametric curve
      for (var t = 0; t < 25; t += 0.001) {
        var x = (1 + 0.25 * Math.cos(75 * t)) * Math.cos(t);
        var y = (1 + 0.25 * Math.cos(75 * t)) * Math.sin(t);
        var z = t + 2.0 * Math.sin(75 * t);
        data.push([x, y, z]);
      }

      option = {
        tooltip: {},
        backgroundColor: '#fff',
        visualMap: {
          show: false,
          dimension: 2,
          min: 0,
          max: 30,
          inRange: {
            color: [
              '#313695',
              '#4575b4',
              '#74add1',
              '#abd9e9',
              '#e0f3f8',
              '#ffffbf',
              '#fee090',
              '#fdae61',
              '#f46d43',
              '#d73027',
              '#a50026'
            ]
          }
        },
        xAxis3D: {
          type: 'value'
        },
        yAxis3D: {
          type: 'value'
        },
        zAxis3D: {
          type: 'value'
        },
        grid3D: {
          viewControl: {
            projection: 'orthographic'
          }
        },
        series: [
          {
            type: 'line3D',
            data: data,
            lineStyle: {
              width: 4
            }
          }
        ]
      };

      option && myChart.setOption(option);
    }
  }
</script>

<style>
</style>